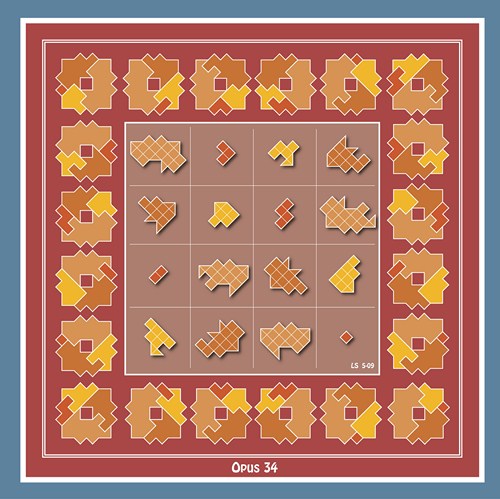
A magic square by Lee Sallows. The 16 pieces progress in area from 1 to 16, and those in each row, column, and long diagonal can be assembled to form the same target shape with area 34.
A magic square by Lee Sallows. The 16 pieces progress in area from 1 to 16, and those in each row, column, and long diagonal can be assembled to form the same target shape with area 34.
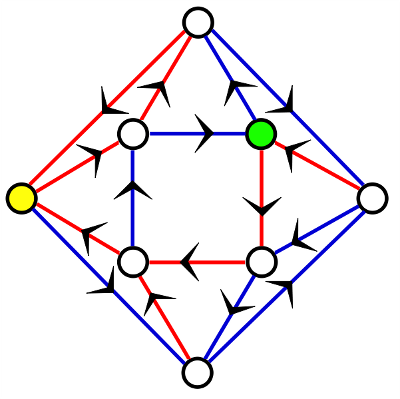
Every road in this little town is a one-way street, and each street is colored either red or blue. This has a helpful effect: If you start at any house in town and follow the sequence blue-red-red three times in a row, you’ll always arrive at the yellow house.
If you follow blue-blue-red three times, you’ll always arrive at the green one.
In 1970 Roy Adler and Benjamin Weiss asked whether it’s always possible to create such a coloring in a given network; in 2009 Avraham Trahtman proved that, within certain constraints, it is.
The sum of the squares of the reciprocals of the positive integers is π2/6.
The sum of their fourth powers is π4/90.
The sum of their sixth powers is π6/945.
The area of the region under the Gaussian curve y = e–x2 is the square root of π.
The probability that two integers chosen at random will have no prime factor in common is 6/π2.
The integer 8 can be written as the sum of two squares of integers, m2 + n2, in four ways, when (m, n) is (2, 2), (2, -2), (-2, 2), or (-2, -2). The integer 7 can’t be written at all as the sum of such squares. Over a very large collection of integers from 1 to n, the average number of ways an integer can be written as the sum of two squares approaches π. Why?
bibliotaph
n. a hoarder of books
In the rare book collection of the archives at Caltech is a copy of Adrien-Marie Legendre’s 1808 text on number theory. It comes from the collection of Eric Temple Bell, who taught mathematics at Caltech from 1926 to 1953. Inside the book is an inscription in Bell’s handwriting:
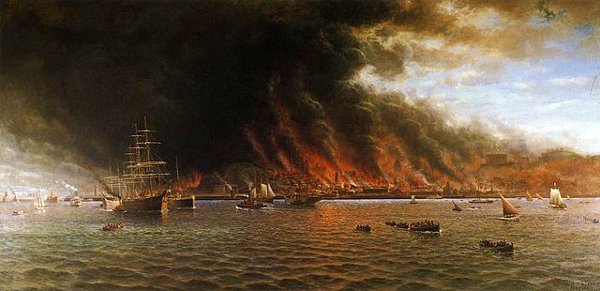
This book survived the San Francisco Earthquake and Fire of 18 April, 1906. It was buried with about 600 others, in a vacant lot, before the fire reached the spot. The house next door to the lot fell upon the cache; the tar from the roof baked the 4 feet of dirt, covering the books, to brick, and incinerated all but 4 books, of which this is one. Signed: E. T. Bell. Book buried just below Grace Church, at California and Stockton Streets. House number 729 California Street.
During the Great Fire of London in 1666, Samuel Pepys came upon Sir William Batten burying his wine in a pit in his garden. Pepys “took the opportunity of laying all the papers of my office that I could not otherwise dispose of” and later buried “my Parmazan cheese, as well as my wine and some other things.” I don’t know whether he ever recovered them.
James Watt perfects the steam engine, 1765:
I had gone to take a walk on a fine Sunday afternoon. I had entered the Green and had passed the old washing house. I was thinking up on the engine at the time and had got as far as the herd’s house, when the idea came into my mind that as steam was an elastic body it would rush into a vacuum, and that if a communication were made between the cylinder and an exhausted vessel it would rush into it and might there be condensed without cooling the cylinder. I had not walked farther than the golf house when the whole thing was arranged clearly in my mind.
Charles Darwin realizes why species diverge, 1840s:
I can remember the very spot in the road, whilst in my carriage, when to my joy the solution occurred to me; and this was long after I had come to Down. The solution, as I believe, is that the modified offspring of all dominant and increasing forms tend to become adapted to many and highly diversified places in the economy of nature.
Henri Poincaré discovers the relation between automorphic functions and non-Euclidean geometries, 1881:
Just at this time, I left Caen, where I was living, to go on a geologic excursion under the auspices of the School of Mines. The incidents of the travel made me forget my mathematical work. Having reached Coutances, we entered an omnibus to go some place or other. At the moment when I put my foot on the step, the idea came to me, without anything in my former thoughts seeming to have paved the way for it, that the transformations I had used to define the Fuchsian functions were identical with those of non-Euclidian geometry. I did not verify the idea; I should not have had time, as, upon taking my seat in the omnibus, I went on with a conversation already commenced, but I felt a perfect certainty. On my return to Caen, for conscience’ sake, I verified the result at my leisure.
Walter Cannon recognizes the fight-or-flight response, 1911:
As a matter of routine I have long trusted unconscious processes to serve me. … [One] example I may cite was the interpretation of the significance of bodily changes which occur in great emotional excitement, such as fear and rage. These changes — the more rapid pulse, the deeper breathing, the increase in sugar in the blood, the secretion from the adrenal glands — were very diverse and seemed unrelated. Then, one wakeful night, after a considerable collection of these changes had been disclosed, the idea flashed through my mind that they could be nicely integrated if conceived as bodily preparations for supreme effort in flight or in fighting.
William Rowan Hamilton conceives the fundamental formula for quaternions, 1843:
But on the 16th day of the same month — which happened to be a Monday, and a Council day of the Royal Irish Academy — I was walking in to attend and preside, and your mother was walking with me, along the Royal Canal, to which she had perhaps driven; and although she talked with me now and then, yet an under-current of thought was going on in my mind, which gave at last a result, whereof it is not too much to say that I felt at once the importance. An electric circuit seemed to close; and a spark flashed forth, the herald (as I foresaw, immediately) of many long years to come of definitely directed thought and work, by myself if spared, and at all events on the part of others, if I should even be allowed to live long enough distinctly to communicate the discovery.
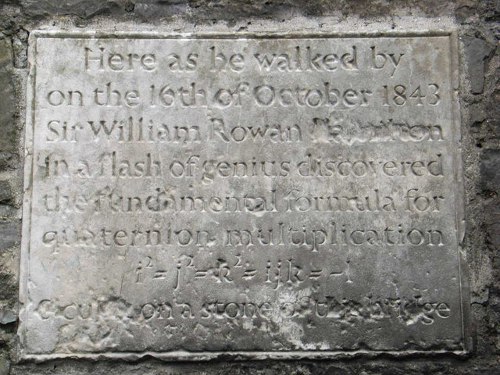
Hamilton adds: “Nor could I resist the impulse — unphilosophical as it may have been — to cut with a knife on a stone of Brougham Bridge, as we passed it, the fundamental formula with the symbols, i, j, k; namely,
i2 = j2 = k2 = ijk = -1
which contains the Solution of the Problem, but of course, as an inscription, has long since mouldered away.” The bridge now bears a permanent plaque marking Hamilton’s achievement (below), and mathematicians undertake an annual walk from Dunsink Observatory to commemorate it.
In the Minnesota Multiphasic Personality Inventory, the subject is asked whether he agrees with a series of statements, such as “There seems to be a lump in my throat much of the time,” “I am not afraid to handle money,” “I feel uneasy indoors,” and “My sleep is fitful and disturbed.” His responses give insights into his personality and psychopathology.
In 2006, poet Katie Degentesh fed these statements into Google and combined the results into a series of poems, which she published as The Anger Scale. Here’s an excerpt from “As a youngster I was suspended from school one or more times for cutting up”:
Everyone knows about Dallas
and its acts of terrifying gorgeousness
a chef in a tall hat piping meringue
discussing the “brain drain”
dropped a slab of concrete on his left foot
before being lured to the guitar
doesn’t recall details of cutting up friend
to create fake masterpiece
Poets Craig Dworkin and Kenneth Goldsmith call this “a ‘pataphysical nosography, evaluating and diagnosing the mental stability of the Internet itself.” But how do we evaluate the results?
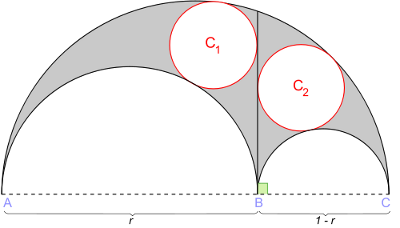
Pick any three points on a line and use each pair of them to define a semicircle, as shown.
Now draw a perpendicular between the two smaller semicircles.
Circles c1 and c2 will always have the same area.
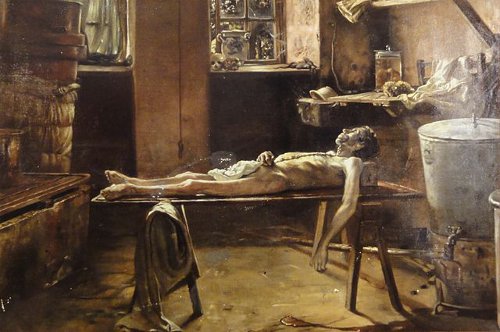
Considerable amusement was excited, a few years ago, by the announcement that a society for mutual autopsy had been formed among the savants of Paris, with a view to advancing knowledge of the structure and physiology of the brain by a correlation of intellectual characteristics with post mortem appearances. The whole thing was generally regarded as a scientific joke of more than ordinary magnitude. But the society appears to have been a genuine fact, and one of its members, M. Asseline, having recently deceased, his brain was carefully examined by his surviving associates, who made a full report of the result to the Anthropological Society of Paris. The following account of the matter is found in Nature, Aug. 14, 1879, p. 377:
‘M. Asseline died in 1878, at the age of 49. He was a republican and a materialist; was possessed of enormous capacity for work, great faculty of mental assimilation, and an extraordinarily retentive memory; and had a gentle, benevolent disposition, keen susceptibilities, refined taste and subtle wit. As a writer he had always displayed great learning, unusual force of style and elegance of diction, and in his intercourse with others he had been unassuming, sensitive and even timid. Yet the autopsy showed such coarseness and thickness of the convolutions that M. Broca pronounced them to be characteristic of an inferior brain. The fossa or depressions, regarded by Gratiolet as a simian character, and as a sign of cerebral inferiority which are often found in women, and in some men of undoubted intellectual inferiority, were very much marked, especially on the left parietooccipital. But the cranial bones were at some points so thin as to be translucent; the cerebral depressions were deeply marked, the frontal suture was not wholly ossified, a decided degree of asymmetry was manifested in the greater prominence of the right frontal, while, moreover, the brain weighed 1,468 grams, i.e., about 60 grains above the average given by M. Broca for M. Asseline’s age. The apparent contradictions between the weight of the brain and the marked character of the parieto-occipital depressions, attracted much attention, and the members of the Société d’Anthropologie have been earnestly invited by M. Hovelacque, in furtherance of science, to join the Société d’Autopsie, to which anthropology is already indebted for many highly important observations. This society is forming a collection of photographs of its members, which are taken in accordance with certain fixed rules.’
— Chicago Medical Journal and Examiner, quoted in New Orleans Medical and Surgical Journal, January 1880
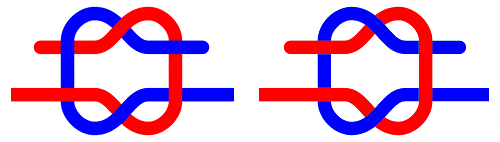
In a 2002 article in Nature, Australian mathematician Burkard Polster concluded that most of us are doing a pretty good job lacing our shoes: “No matter whether you prefer to lace them straight or criss-crossed, you come close to maximizing the total horizontal tension when you pull on the two ends of one of your shoelaces.”
When it comes to tying them, though, we don’t do so well. “A very large number of people, possibly even the majority, do tie their shoe laces much worse than the rest,” Polster wrote in his 2006 book-length followup, The Shoelace Book. Most of us tie a shoe by placing one half-granny knot on top of another, but this can produce either a very unstable granny knot (left) or a very stable reef knot (right), depending on whether the two half-knots have the same or opposite orientation. (It’s not essential that the second half-granny is typically tied with loops; these are omitted in the diagrams.)
“Hundreds of years of trial and error have led to the strongest way of lacing our shoes,” Polster wrote in Nature, “but unfortunately the same cannot be said about the way in which most of us tie our shoelaces — with a granny knot.”
(Burkard Polster, “What Is the Best Way to Lace Your Shoes?” Nature 420:6915 [Dec. 5, 2002], 476.)
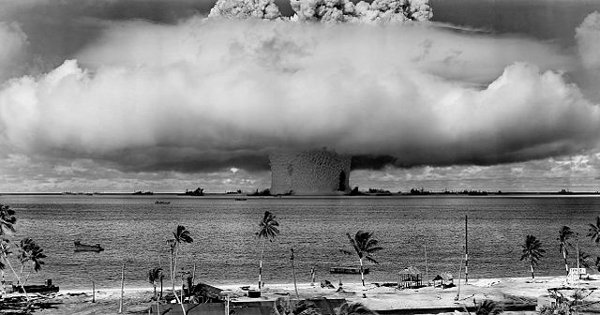
When I was a child, it was believed that animals became extinct because they were too specialized. My father used to tell us about the saber-tooth tiger’s teeth — how they got too big and the tiger couldn’t eat because he couldn’t take game anymore. And I remember my father saying, with my brother sitting there, ‘I wonder what it will be with the human beings that will be so overspecialized that they’ll kill themselves off?’
My father never found out that my brother was working on the bomb.
— Richard Feynman’s sister Joan, quoted in Christopher Sykes, No Ordinary Genius, 1994