When H.M. Hyndman claimed that 25 percent of Londoners lived in abject poverty, Charles Booth was skeptical. So he organized his own investigation. His findings, published as Life and Labour of the People in 1889, showed that fully 35 percent of residents in the East End were poor.
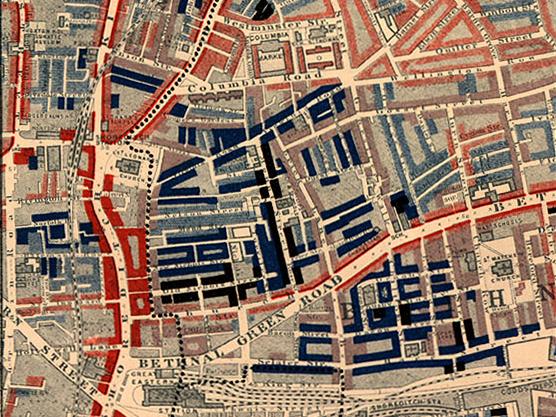
In the map above, the red areas are “middle class, well-to-do,” light blue areas are “poor, 18s to 21s a week for a moderate family,” dark blue areas are “very poor, casual, chronic want,” and black areas are the “lowest class … occasional labourers, street sellers, loafers, criminals and semi-criminals.” (More of Booth’s maps can be seen here.)
A second volume, covering the rest of London, was published in 1891, and a third, in 17 volumes, appeared in 1902. He pressed for many reforms, but he remained optimistic. “What is needed is more vigorous life in every direction: social, educational, industrial, political and religious,” he concluded. “If they be evidences of vigour, pleasure seeking and extravagance need not be condemned, nor even some excess be dreaded. We may confidently trust in the balance of forces; a running stream is always wholesome; a stagnant pool, the danger.”