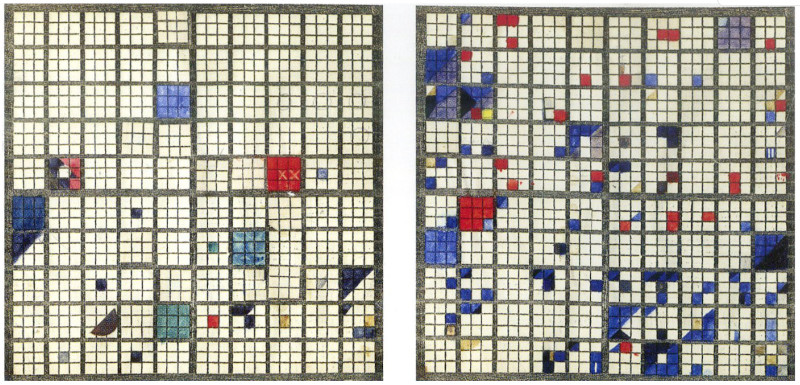
Elizabeth Peabody hated rote learning. So the 19th-century American educator adopted the “Polish system,” a graphical means to help students recall reams of historical facts. Invented in the 1820s by Antoni Jażwiński and popularized by Józef Bem, the system relies on a series of 10×10 grids. The location of an event gives its date, the symbol that records it shows its type, and its color indicates the nations involved. A student who wanted to indicate that a revolution took place in America in 1776 would choose the grid for the 18th century, find the square for the 76th year (row 7, column 6), and paint a square using the color designating the British colonies in North America. The square indicates insubordination; a triangle would mean a revolt, an X a conspiracy.
The system is largely forgotten today, but it was immensely popular in Europe and North America in the early 18th century. In the 1830s it was approved for use throughout the French educational system, and Peabody toured the United States offering a book of her own, blank charts and a special set of paints. “Instructors who are themselves not well educated in history, may yet dare to undertake to teach chronology with the help of this manual,” she wrote, “and it must be obvious that highly-accomplished teachers can unfold and develop the subject to an indefinite extent.”
“The results of Peabody’s appropriation of the Polish System are both handsome and surprising,” write Daniel Rosenberg and Anthony Grafton in Cartographies of Time (2012). “Surviving copies of the charts in libraries look nothing like one another. Each bears the imprint of an individual student’s imagination.”