In 1878 W. A. Whitworth imagined an election between two candidates. A receives m votes, B receives n votes, and A wins (m>n). If the ballots are cast one at a time, what is the probability that A will lead throughout the voting?
The answer, it turns out, is given by the pleasingly simple formula

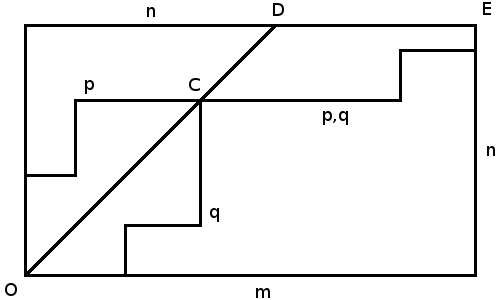
Howard Grossman offered the proof above in 1946. We start at O, where no votes have been cast. Each vote for A moves us one point east and each vote for B moves us one point north until we arrive at E, the final count, (m, n). If A is to lead throughout the contest, then our path must steer consistently east of the diagonal line OD, which represents a tie score. Any path that starts by going north, through (0,1), must cut OD on its way to E.
If any path does touch OD, let it be at C. The group of such paths can be paired off as p and q, reflections of each other in the line OD that meet at C and continue on a common track to E.
This means that the total number of paths that touch OD is twice the number of paths p that start their journey to E by going north. Now, the first segment of any path might be up to m units east or up to n units north, so the proportion of paths that start by going north is n/(m + n), and twice this number is 2n/(m + n). The complementary probability — the probability of a path not touching OD — is (m – n)/(m + n).
(It’s interesting to consider what this means. If m = 2n then p = 1/3 — even if A receives twice as many votes as B, it’s still twice as likely that B ties him at some point as that A leads throughout.)